Making dense things feel simple
Away from client work I build interfaces for data-heavy tools. The design problem is always the same one: deciding what a person needs on first glance, and what can wait.
Sense & Stock
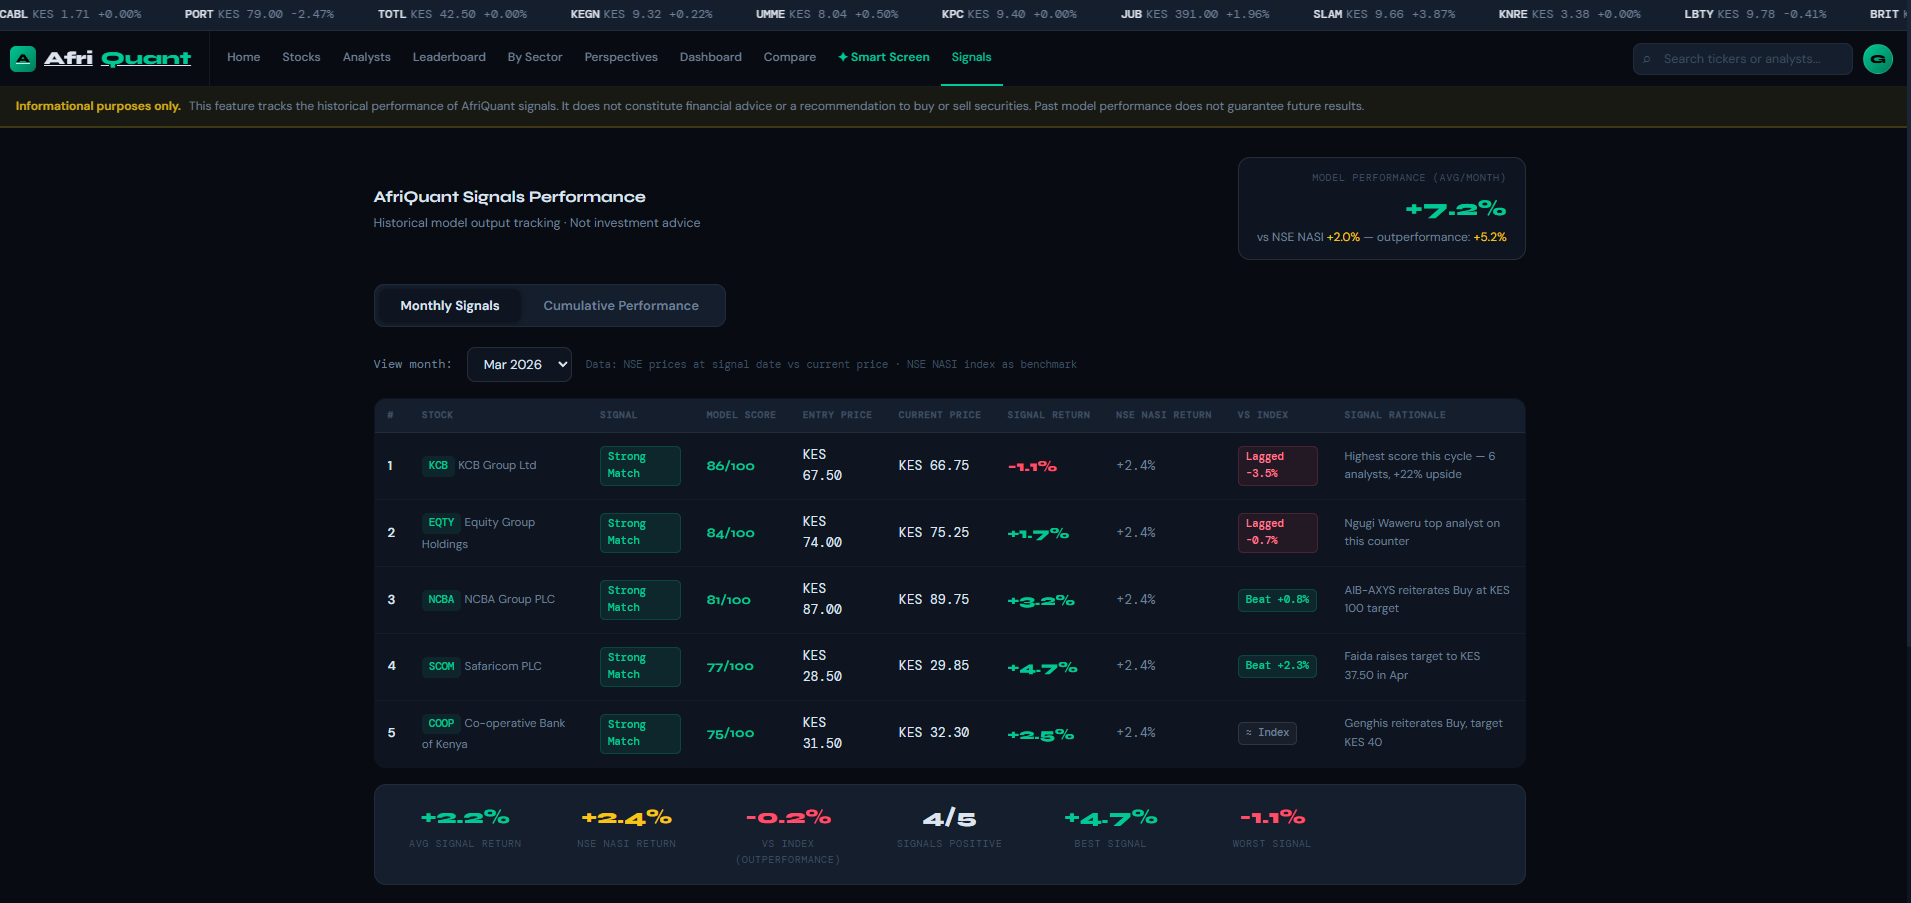
A stock market intelligence platform that turns model output into something a person can read at a glance: scored signals, entry and current prices, and performance measured against a benchmark.
The interface problem
Model output is dense by nature. The work was deciding what a visitor needs on first glance, what belongs one level down, and what can be left out entirely without losing the meaning.
Approach
Signals are presented as a scannable table rather than a wall of charts, with price movement and realised return sitting beside each row so the numbers can be compared without switching views.
Outcome
A live dashboard where the state of the market is legible in a few seconds, and the detail is there for anyone who wants to go further.
Client work is where most of my time goes.
If you are here to see websites rather than side projects, the work page is the one to read.